


When meteorologists determine atmospheric instability, they quantitatively measure and represent various atmospheric conditions. Two important atmospheric conditions they examine to quantify and express as a measure of instability are the lapse rates for both ambient and dewpoint temperatures. These lapse-rates are then plotted on what is called a Skew-T diagram. You can access Skew-T diagrams from the NOAA’s National Weather Service site with this link. Lapse, in this context, is the rate of decrease in temperature as altitude increases.
As you learn about Skew-T diagrams, you will see that in addition to temperature, Skew-T diagrams show wind speed and wind direction with altitude, ultimately depicting wind shear. These wind measurements combine with lapse rates to help estimate thunderstorm sustainability. If there is ample wind shear and ample convective available potential energy (CAPE), thunderstorms form and can be long lasting. Said another way, certain atmospheric conditions are conducive to what variety of thunderstorms have potential to develop. Among the varieties are pulse cells (what pilots call airmass or pop-ups that typically last 20 to 30 minutes) up to supercells characterized by the presence of a mesocyclone that may last up to hours and have the potential to be severe.
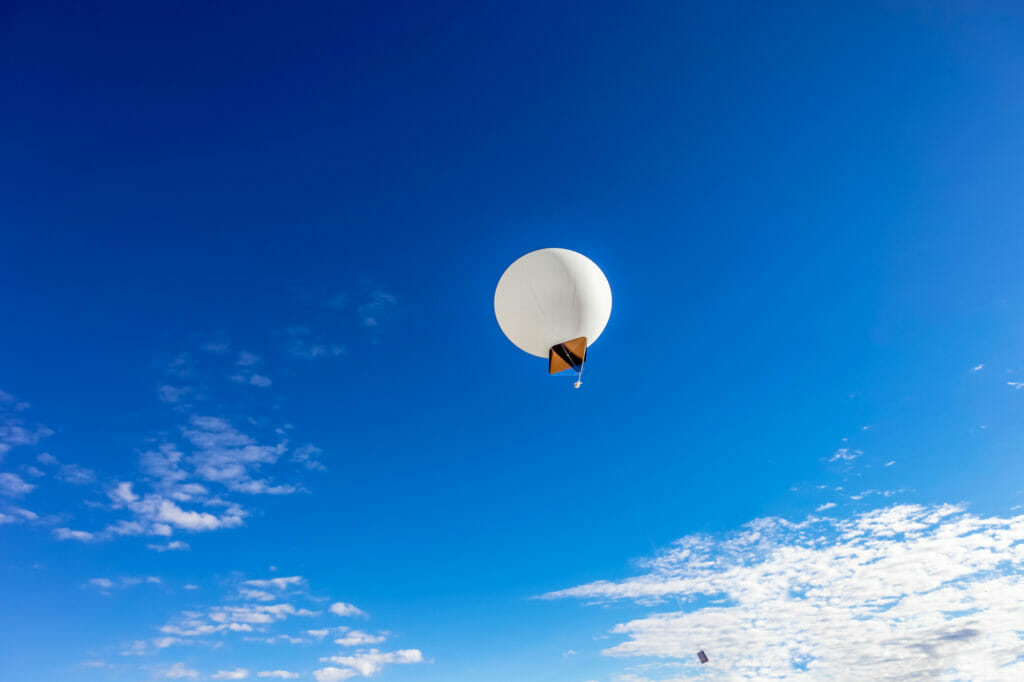
Balloon launches
The National Weather Service (NWS) launches weather balloons to attain atmospheric soundings. These soundings contribute data for the creation of Skew-T diagrams. The NWS launches on a set schedule with exceptions when the weather is poised for exceptional and significant convection. In the interim period between launches, the atmosphere can change, sometimes dramatically. We must always be aware that just because the morning and/or evening soundings show little potential for convection, it does not mean it cannot occur – in some very big ways.
The meteorologists’ CAPE
Regardless of your superhero cape, meteorologists are known for their CAPE. The NWS uses Skew-T diagrams to arrive at a final measurement of atmospheric instability or buoyancy. They call this CAPE, which stand for convective available potential energy.


The simple definition to remember is that CAPE is a measure of how much the atmosphere is “loaded” for severe weather. CAPE is derived from the Skew-T diagram and the parameters described above. It is expressed numerically in J/kg or joules/kilograms. A joule is a measurement of energy which is all we really need to know. But, the higher the J/kg number, the higher the buoyancy of the atmosphere and hence the POTENTIAL for convection. Please be aware, a high CAPE does not guarantee severe weather. Remember that to sustain thunderstorms, winds (speed, direction and amount of shear) must also be factored. It follows therefor, that you might have a high CAPE environment, with little wind shear and therefore the likelihood of convection is lower. A Skew-T diagram is a collection of data that might indicate an “atmospheric boom.”
Pay attention
Aside from the description that the NWS provides for CAPE and Skew-T diagrams, pilots can note and interpret the slope (lapse) of the temperatures (dew and ambient) ourselves as indicators of atmospheric potential. Specifically, the gradient of these temperature lines and the separation from one another can alert us to overall storm potential. (The area between these two lines as depicted by the diagram is the CAPE). Observing the spread between the two lines of temperature can provide a rough idea of whether there is little or significant CAPE. The bigger the area between the lines, the more buoyant the atmosphere is going to be.
One final note on Skew-T’s and with regard to CAPE is an atmospheric cap. An atmospheric cap can be thought of as that – a lid on the atmosphere’s ability to go up. You can see a cap on a Skew-T by the sudden change in lapse rate (in this case, an increase in temperature with altitude). Generally, caps put a lid on convection, despite there sometimes being a great deal of atmospheric lift. This instability/CAPE is often below the cap. Beware however! Just like when you shake a bottle of carbonated beverage and then take the cap off, caps can be overcome. Forecasters frequently refer to caps in the sounding environment and their potential to be overcome or not.
In summary
CAPE is not something you see in aviation forecasts, so it is not necessarily a direct tool for what you do as a pilot. It is nice to know more about it and how it is being considered by forecasters when actual predictions are made. Be enlightened to the existence of this weather product and to gain a basic understanding of how atmospheric buoyancy is quantified.
As pilots, we are required to learn the basics of many subjects related to our vocation. We learn about systems. We do not learn to repair them. We learn flight about physiology. We do not learn to become doctors. However, I believe weather is far more than basic and that we should understand it more deeply and continue to expand our knowledge. We should go above and beyond the standard pilot curriculum where weather is concerned. I hope my SQUALL LINES help you do just that.


